Cross-grader comparison
Show each grader separately. Do not equate their grades or label combined counts as the total number of unique cards.
Query graded counts and distributions by card, company, and grade for detail pages, collection comparisons, and analysis.
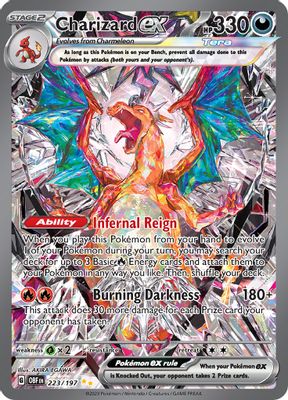
Pokémon · 223/197 · Holofoil
Show grader, card version and date together so every distribution has context.
One card. One statistical scope.
Link sets, numbers and versions by card ID so graded counts stay with the right record, separate from similar names or artwork.
Keep the grader as a separate dimension for each distribution, preserving differences in grading systems and data sources.
Make grade distributions easy to read.
Use grade counts to build bar charts, grade lists, or detail cards and highlight the grades you want to compare.
Aggregate within the same company, card, and date scope. Show totals alongside grade counts and retain scope details.
Separate data changes from their meaning.
Date each distribution snapshot. Before comparing, confirm the same card scope and company to avoid misleading changes.
Link catalog details and price records by card identity. Show distinct dimensions side by side for analysis.
Show each grader separately. Do not equate their grades or label combined counts as the total number of unique cards.
Show “No data” for missing records. Show zero only when the returned count is explicitly 0. Retain grader and date to distinguish missing coverage from reported counts.
Confirm language and variant before linking grade counts. Resolve uncertain recognition results before querying Population.
Match identity first. Bring counts, grades, and dates into your workflow.
Get a card ID from the catalog or recognition. Confirm the version and grader you need.
Query Population for the selected scope. Receive per-grade counts, totals and the data date.
Render grade counts as a list or chart alongside card details, grading records and prices.
This sample uses one Charizard ex card and returns the grader, per-grade counts and data date together.
Show distributions for the matching company and variant beside listings, with snapshot dates for clear buyer and seller context.
View marketplace solutionAdd Population distributions to graded-card collections and compare counts across grades for richer context.
View collection solutionView grade counts beside prices for the same version. Organize by grader and date without treating population counts as a price estimate.
View analytics solutionNo. Population describes grading counts and score distributions within a defined scope. Print runs, Raw (ungraded) cards, and surviving copies differ; resubmissions can also affect interpretation.
Do not treat the sum as a unique card total. Scope, grading scales, and resubmissions differ. Compare and display companies separately.
Graded card recognition extracts card details, cert numbers and label text. Population provides counts for a specific card and grader. Link both by card identity; recognition alone does not return every grader’s statistics.
Not always. Missing fields differ from explicit zeros. Display No data and 0 separately rather than charting unknown counts as zero.
Population adds a grading-count dimension, but does not establish print runs, demand, or value. Show catalog, price, and grade distributions with clear definitions.
Check Population coverage for your sets, versions and graders, including the data date. A catalog entry or readable grading label does not guarantee Population availability.
Connect an API, request a key or discuss your data needs.
Tell us what you are building. Let us find the next step.
Define product goals, data scope, and API needs.
Combine recognition, imaging and data.
Once the plan is agreed, we help you get an API key.