Connect data for the same card
Define the target by card ID, language, and variant. Do not mix different editions with similar names or images.
Connect catalog, prices and graded counts for market dashboards, card research and analytics.
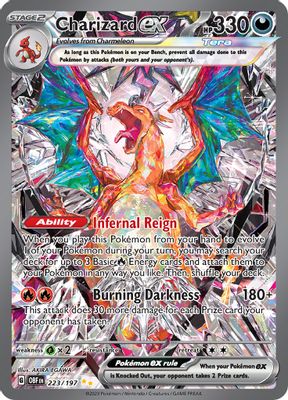
223/197 · Holofoil
$90.41
7-day change −3.87%
Past 30 days · Same-printing prices
Grader
By grader and reporting date
Define the target by card ID, language, and variant. Do not mix different editions with similar names or images.
Keep currency, price type, and date in trend and comparison views for a clear basis of comparison.
Organize Population by grader, grade and date to view graded supply alongside prices.
Data services supply source records. Your platform defines analysis dimensions, display and calculations.
Select category, set, card, and variant from the catalog to define your analysis.
One card identityQuery market and grading data separately, retaining currency, company, grade, and snapshot dates.
Add a research dimensionOrganize by version, price type and time range. Handle missing records and differing update times.
Build comparable datasetsShow trends, grade counts or set comparisons with field definitions for reference.
Feed your analysis modelCard identity links the data. Prices and grading counts retain their own dimensions.
Filter by language and version to keep chart comparisons consistent.
Compare prices consistently by type, currency, and date.
Population counts by company and grade, with snapshot dates.
Obsidian Flames · 223/197
Holofoil · EnglishThe catalog identifies the card. Prices and Population add market and grading context.
Asks, sales and graded counts answer different questions. Preserve what each field means.
Population counts graded cards, not all surviving copiesExplain every value, even when records are missing, updates differ or the target changes.
Keep separate timestamps and date ranges for each source. Do not present data from different dates as one snapshot.
Mark missing records as unavailable or gaps in charts. Do not turn missing values into false price movements.
Keep language and version as filters. Label cross-version comparisons clearly so users can understand the differences.
Plan how data flows through every step of your business.
More questions? Contact usYes. Link the same card, then display price records and grade distributions side by side. Keep currencies, companies, and timestamps distinct; your platform manages analysis.
Define the card with catalog and card ID, then verify language and variant. Use the same definition for price, Population, and display filters.
Define price type, currency and time range before comparing. Show different scopes separately and calculate only with records that meet your analysis rules.
Define counting rules first. Records across graders may include resubmissions or crossovers. Combined counts do not directly represent print runs or surviving physical cards.
Show gaps or No records alongside the available date range. Do not replace missing data with zero when calculating changes.
Map catalog, price, and Population data to your fields and analytics flow. Your business manages storage, calculations, access, and charting.
Connect an API, request a key or discuss your data needs.
Tell us what you are building. Let us find the next step.
Define product goals, data scope, and API needs.
Combine recognition, imaging and data.
Once the plan is agreed, we help you get an API key.